

Note
Go to the end to download the full example code.
Bivariate colormap reference#
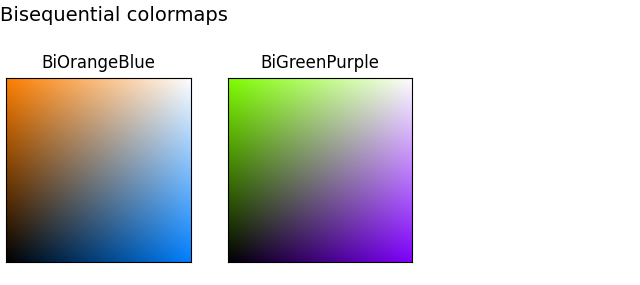
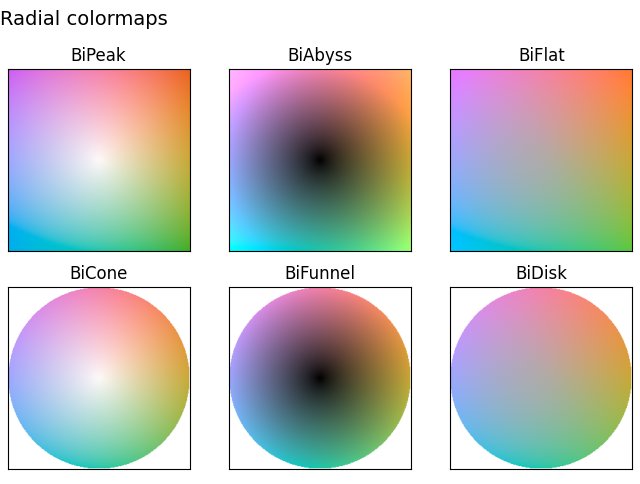
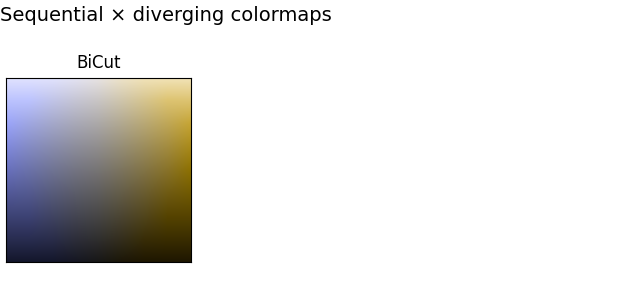
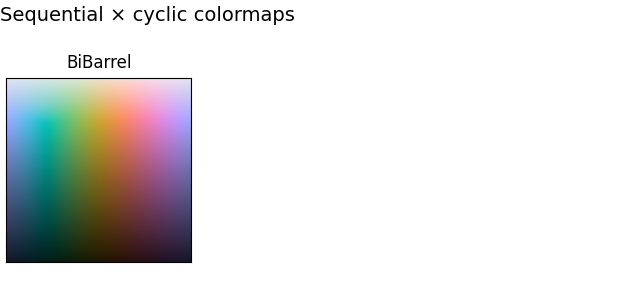
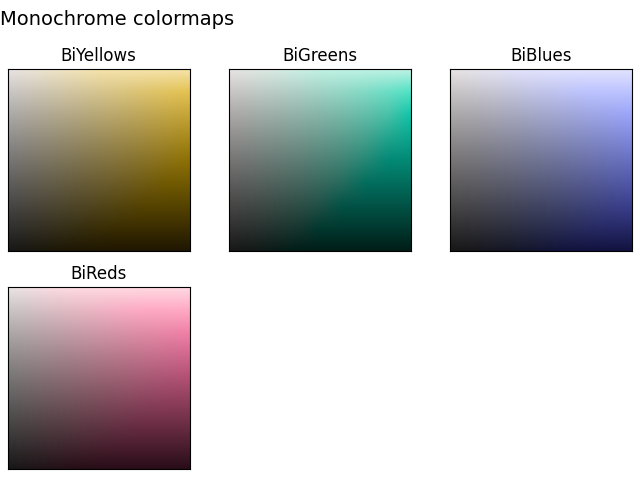
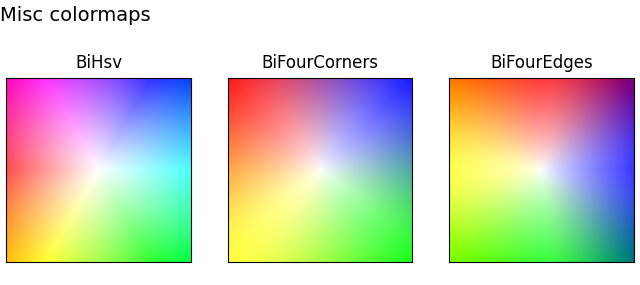
Reference for bivariate colormaps included with Matplotlib.
import matplotlib.pyplot as plt
import numpy as np

import matplotlib
from matplotlib.colors import BivarColormapFromImage

cmaps = [('Bisequential', [
            'BiOrangeBlue', 'BiGreenPurple']),
         ('Radial', [
                     'BiPeak', 'BiAbyss', 'BiFlat',
                     'BiCone', 'BiFunnel', 'BiDisk']),
         ('Sequential × diverging', [
                     'BiCut']),
         ('Sequential × cyclic', [
                     'BiBarrel']),
         ('Monochrome', [
                     'BiYellows', 'BiGreens', 'BiBlues', 'BiReds']),
         ('Misc', [
                     'BiHsv', 'BiFourCorners', 'BiFourEdges']),]


def plot_bivariate_cmaps(cmap_category, cmap_list):
    # Create figure and adjust figure height to number of colormaps
    nrows = len(cmap_list)//3 + (len(cmap_list) % 3 > 0)
    figh = 0.7 + 0.15 + (nrows)*2
    fig, axs = plt.subplots(ncols=3, nrows=nrows, figsize=(6.4, figh))
    axs = axs.ravel()
    fig.subplots_adjust(top=1-0.7 / figh, bottom=.15/figh, left=0.01, right=0.99)

    fig.suptitle(f"{cmap_category} colormaps", fontsize=14, ha='left', x=0)

    for ax, cmap_name in zip(axs, cmap_list):
        cmap = matplotlib.bivar_colormaps[cmap_name]
        ax.imshow(cmap.lut, origin='lower')
        ax.text(0.5, 1.03, cmap_name, va='bottom', ha='center', fontsize=12,
                transform=ax.transAxes)
    for ax in axs:
        if len(ax.images) == 0:
            ax.remove()

    # Turn off ticks
    for ax in axs:
        ax.set_yticks([])
        ax.set_xticks([])


for cmap_category, cmap_list in cmaps:
    plot_bivariate_cmaps(cmap_category, cmap_list)
Orienting bivariate colormaps#
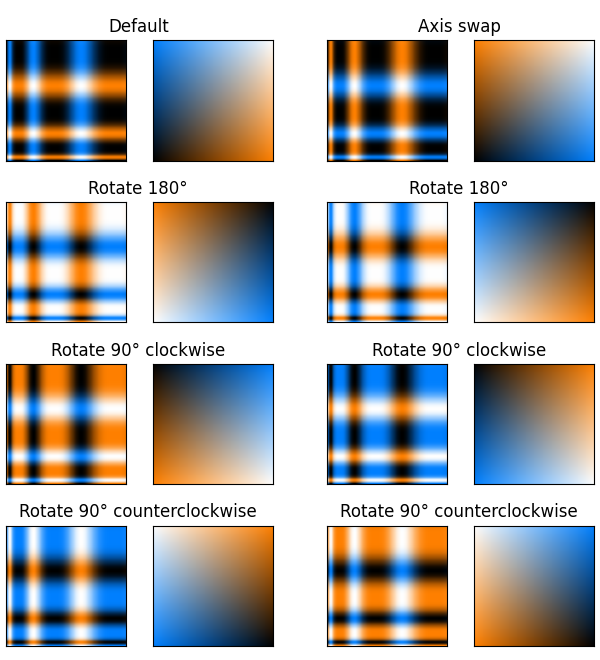
Additional orientations of the built-in colormaps can be obtained by resampling, for a total of eight orientational variants.
fig, axs = plt.subplots(4, 2, figsize=(6, 6.6))
fig.subplots_adjust(top=0.95, bottom=0.01, left=0.01, right=0.99)

axs = axs.ravel()

cmap = matplotlib.bivar_colormaps['BiOrangeBlue']

# image data
im_A = np.arange(100)[np.newaxis, :]*np.ones((100, 100))
im_B = np.arange(100)[:, np.newaxis]*np.ones((100, 100))
im_A[:, :] = np.sin(im_A**0.5)**4
im_B[:, :] = np.sin(im_B**0.5)**4

cmaps = []
# default and axis swap
resampling = (np.linspace(0, 1, 256)[np.newaxis, :]*np.ones((256, 256)),
              np.linspace(0, 1, 256)[:, np.newaxis]*np.ones((256, 256)))
cmaps.append(BivarColormapFromImage(cmap(resampling), name='Default'))
resampling = (np.linspace(0, 1, 256)[:, np.newaxis]*np.ones((256, 256)),
              np.linspace(0, 1, 256)[np.newaxis, :]*np.ones((256, 256)))
cmaps.append(BivarColormapFromImage(cmap(resampling), name='Axis swap'))

# rotation clockwise
resampling = (np.linspace(1, 0, 256)[np.newaxis, :]*np.ones((256, 256)),
              np.linspace(1, 0, 256)[:, np.newaxis]*np.ones((256, 256)))
cmaps.append(BivarColormapFromImage(cmap(resampling), name='Rotate 180°'))
resampling = (np.linspace(1, 0, 256)[:, np.newaxis]*np.ones((256, 256)),
              np.linspace(1, 0, 256)[np.newaxis, :]*np.ones((256, 256)))
cmaps.append(BivarColormapFromImage(cmap(resampling), name='Rotate 180°'))

# rotation clockwise
resampling = (np.linspace(1, 0, 256)[:, np.newaxis]*np.ones((256, 256)),
              np.linspace(0, 1, 256)[np.newaxis, :]*np.ones((256, 256)))
cmaps.append(BivarColormapFromImage(cmap(resampling), name='Rotate 90° clockwise'))
resampling = (np.linspace(0, 1, 256)[np.newaxis, :]*np.ones((256, 256)),
              np.linspace(1, 0, 256)[:, np.newaxis]*np.ones((256, 256)))
cmaps.append(BivarColormapFromImage(cmap(resampling), name='Rotate 90° clockwise'))
# rotation clockwise
resampling = (np.linspace(0, 1, 256)[:, np.newaxis]*np.ones((256, 256)),
              np.linspace(1, 0, 256)[np.newaxis, :]*np.ones((256, 256)))
cmaps.append(BivarColormapFromImage(cmap(resampling),
             name='Rotate 90° counterclockwise'))
resampling = (np.linspace(1, 0, 256)[np.newaxis, :]*np.ones((256, 256)),
              np.linspace(0, 1, 256)[:, np.newaxis]*np.ones((256, 256)))
cmaps.append(BivarColormapFromImage(cmap(resampling),
             name='Rotate 90° counterclockwise'))


for ax, cmap in zip(axs, cmaps):
    cim = ax.imshow((im_A, im_B), cmap=cmap, origin='lower')
    ax.set_yticks([])
    ax.set_xticks([])
    ax.set_title(cmap.name, x=1.1, ha='center')

    cax = fig.colorbar_2D(cim, fraction=0.45)
    cax.set_yticks([])
    cax.set_xticks([])
Discretized bivariate colormaps#
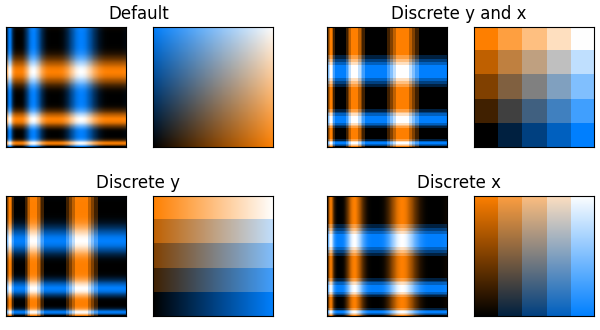
Discretized colormaps can also be made by resampling
fig, axs = plt.subplots(2, 2, figsize=(6, 3.3))
fig.subplots_adjust(top=0.95, bottom=0.01, left=0.01, right=0.99)
axs = axs.ravel()

# image data
im_A = np.arange(100)[np.newaxis, :]*np.ones((100, 100))
im_B = np.arange(100)[:, np.newaxis]*np.ones((100, 100))
im_A[:, :] = np.sin(im_A**0.5)**4
im_B[:, :] = np.sin(im_B**0.5)**4


cmap = matplotlib.bivar_colormaps['BiOrangeBlue']
cmaps = []

resampling = (np.linspace(0, 1, 256)[np.newaxis, :]*np.ones((256, 256)),
              np.linspace(0, 1, 256)[:, np.newaxis]*np.ones((256, 256)))
cmaps.append(BivarColormapFromImage(cmap(resampling), name='Default'))


# discretization
resampling = (np.linspace(0, 1, 5)[:, np.newaxis]*np.ones((5, 5)),
              np.linspace(0, 1, 5)[np.newaxis, :]*np.ones((5, 5)))
cmaps.append(BivarColormapFromImage(cmap(resampling), name='Discrete y and x'))
resampling = (np.linspace(0, 1, 5)[:, np.newaxis]*np.ones((5, 256)),
              np.linspace(0, 1, 256)[np.newaxis, :]*np.ones((5, 256)))
cmaps.append(BivarColormapFromImage(cmap(resampling), name='Discrete y'))
resampling = (np.linspace(0, 1, 256)[:, np.newaxis]*np.ones((256, 5)),
              np.linspace(0, 1, 5)[np.newaxis, :]*np.ones((256, 5)))
cmaps.append(BivarColormapFromImage(cmap(resampling), name='Discrete x'))

for ax, cmap in zip(axs, cmaps):
    cim = ax.imshow((im_A, im_B), cmap=cmap, origin='lower')
    ax.set_yticks([])
    ax.set_xticks([])
    ax.set_title(cmap.name, x=1.1, ha='center')

    cax = fig.colorbar_2D(cim, fraction=0.45)
    cax.set_yticks([])
    cax.set_xticks([])
See also: Multivariate colormap reference
References
The use of the following functions, methods, classes and modules is shown in this example:
Total running time of the script: (0 minutes 2.155 seconds)